Anomaly Detection with Time Series
Discovering anomal points in a trend.
When a trend is evaluated, there are high and low values, some values could be outliers however. It means values that deviate from the main trend and do not follow the same pattern as the others. This projects use a Z-score to detect anomal pont in a trend.
Tools
I transform processes and enhance operational efficiency through advanced analytics and data visualization, as well as by developing artificial intelligence.


My 4 Steps
It is worth mentioning that these steps are not mutually exclusive; they can be executed simultaneously depending on the project’s needs. Additionally, I continuously optimize this process based on feedback from other stakeholders.
Architecture
For building this project many technologie were involved. – Docker compose manage the mongodb database.
- Python is the backend to get and return the answer.
- For the front-end “react” is the selected library for building the user interfaces. Mui is for the look and feel of the page. And finally Plotly is use for building the chart.
- Ollama is used for having llama 3 model to send the prompt and get an answer.
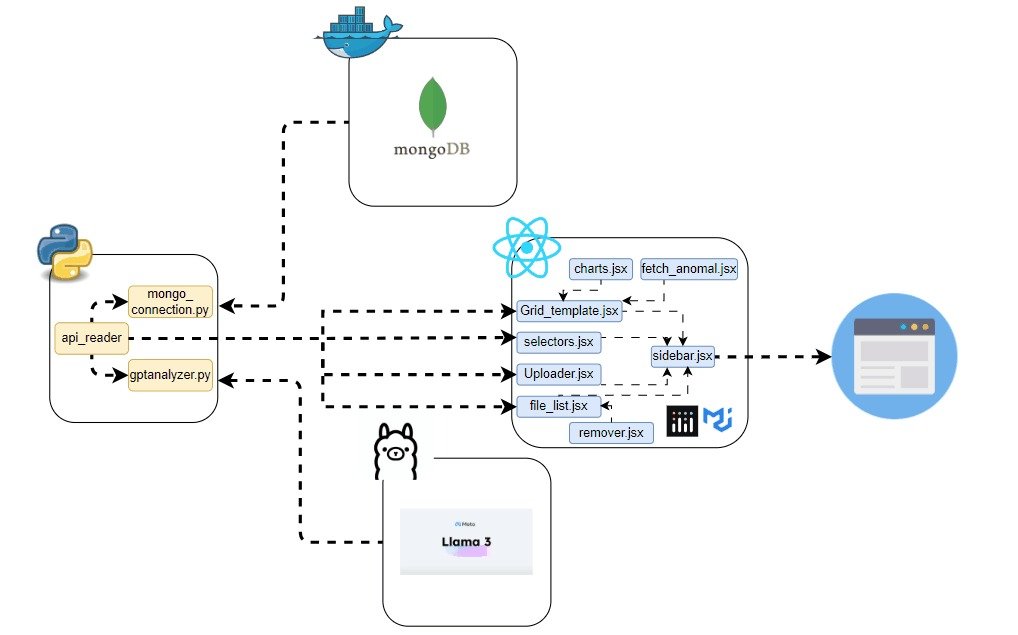
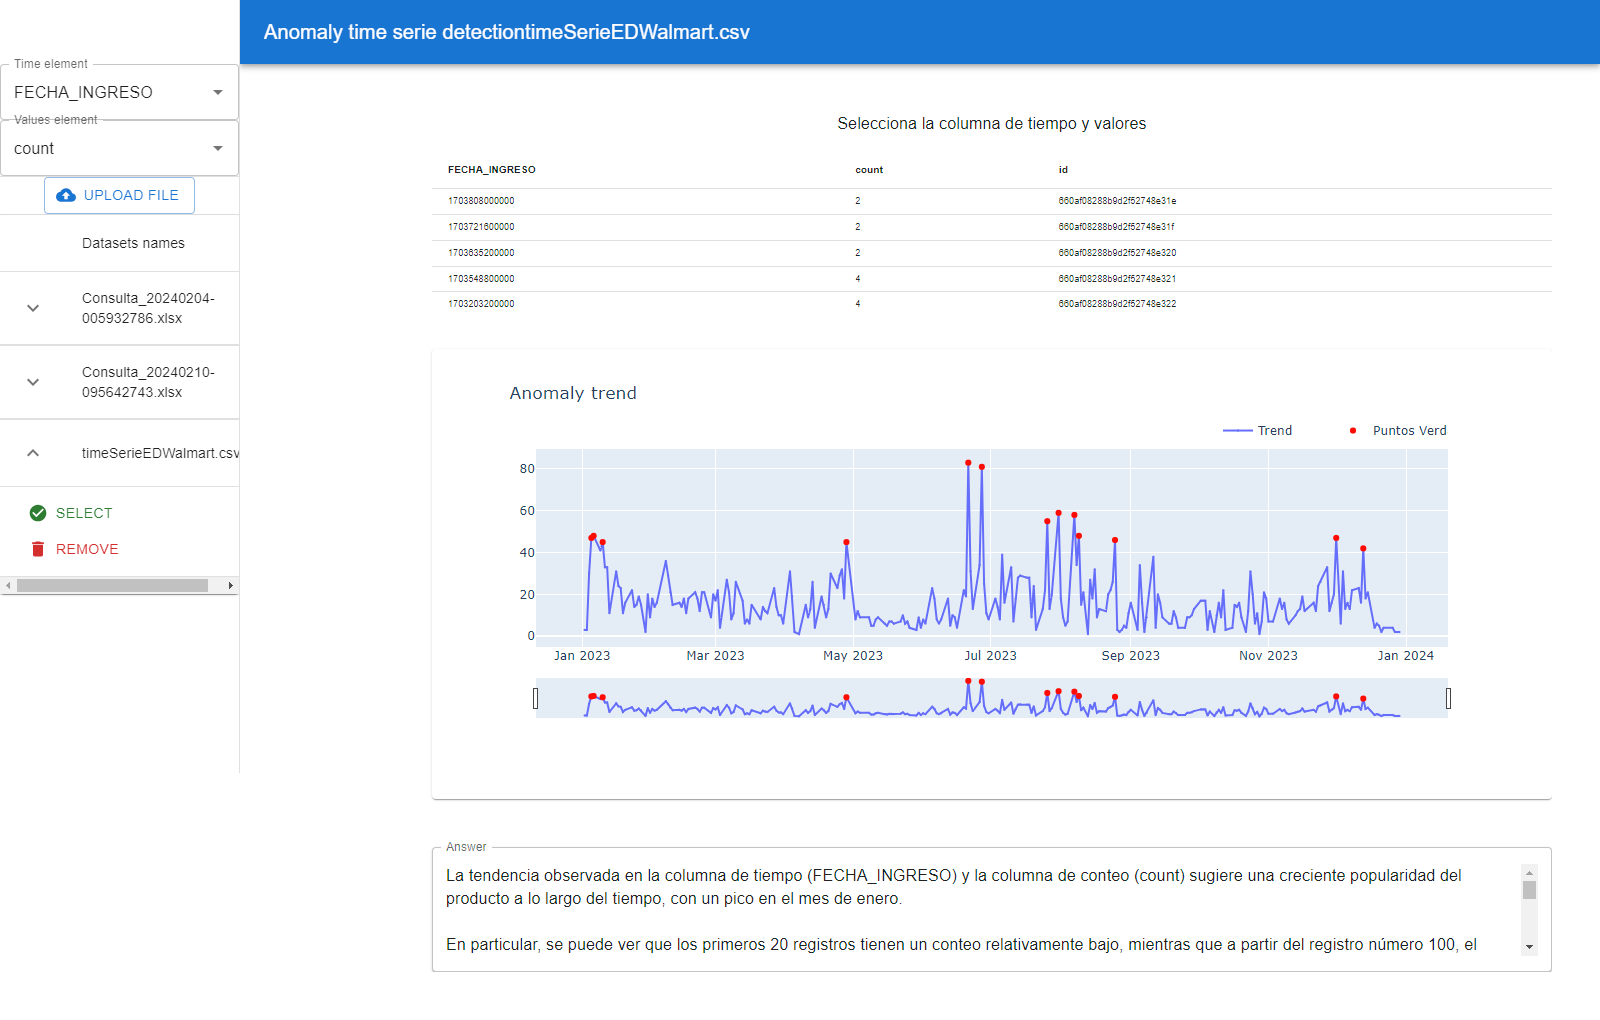
Anomaly and trend analysis application with Llama 3
The general purpose of this project is have a front app in which is possible load a csv file and get the anomalous points. Also getting a description about the trend involving a llm model, in this case the model is llama 3.
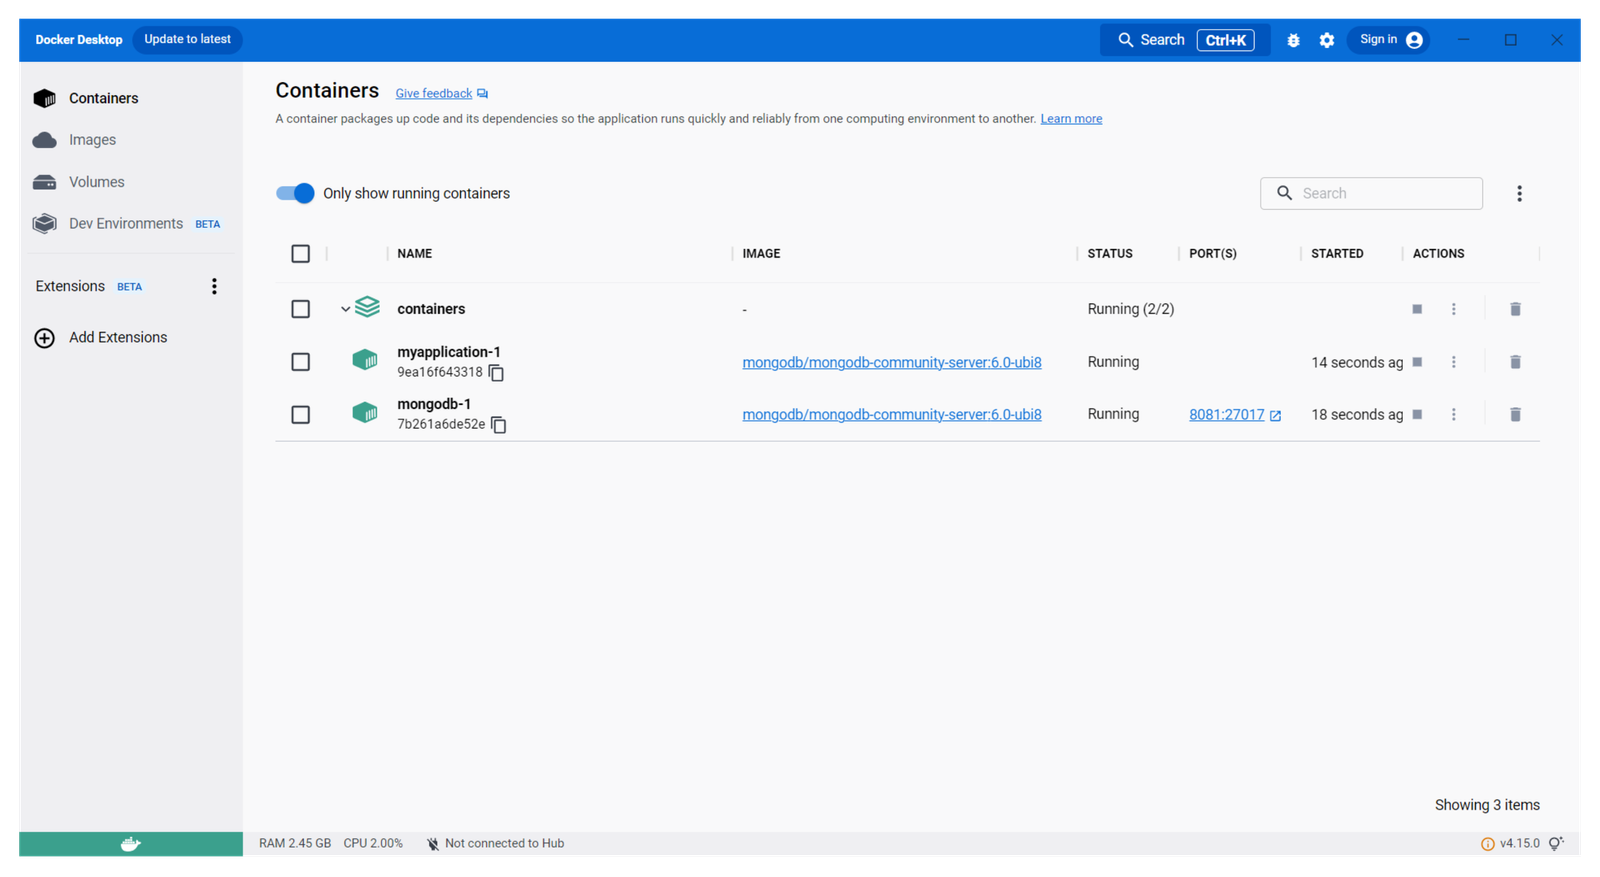
Docker compose
For testing in any computer docker allow use the database without installations, in a virtual machine only running a yaml file and has persistence.
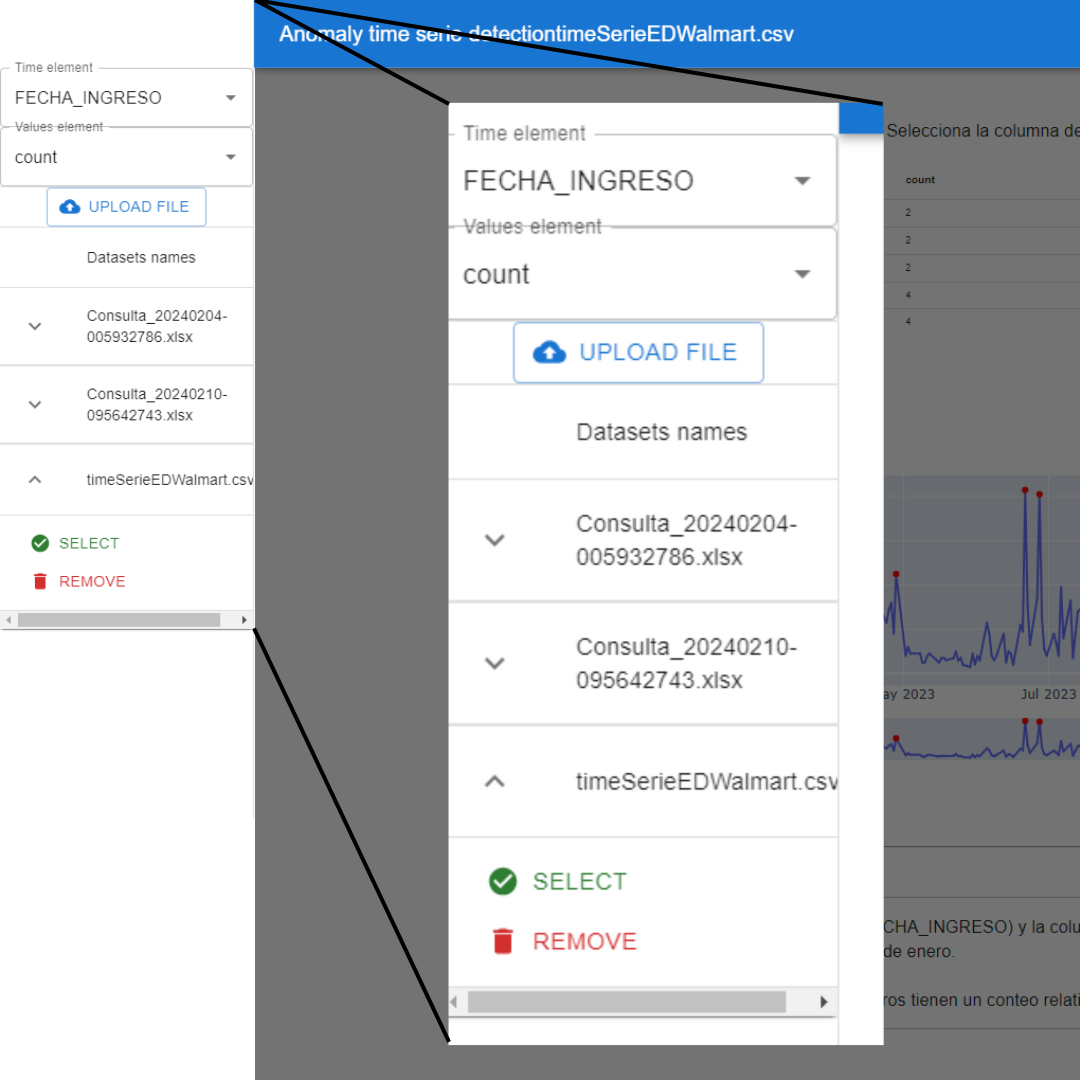
Upload and analyze your CSV files
In this section, users can upload CSV files to be analyzed by advanced anomaly detection and trend analysis algorithms. By simply clicking the “Upload File” button, the CSV file is selected from the device, and the system will process the data to identify any anomalous points.
Anomaly detection
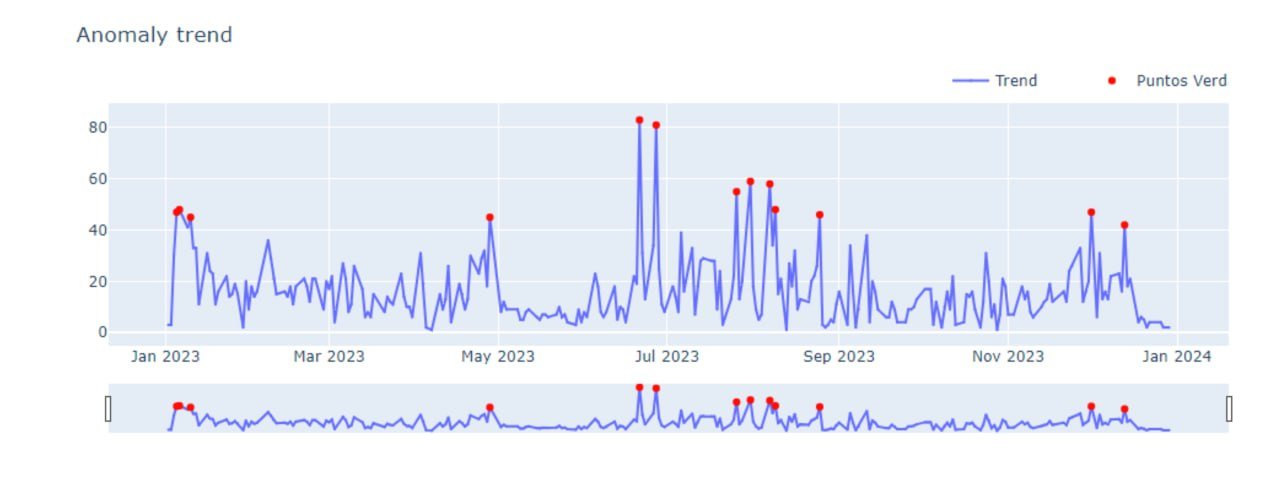
For detecting atypical values in the trend the selected algorithm was z-score. This one works using the mean and the standard deviation to identify de desviacion about one value with the rest of those. In the chart the red points marks the outliers identified.
Unlock Insights with Llama 3: Simplifying data analysis for Everyone
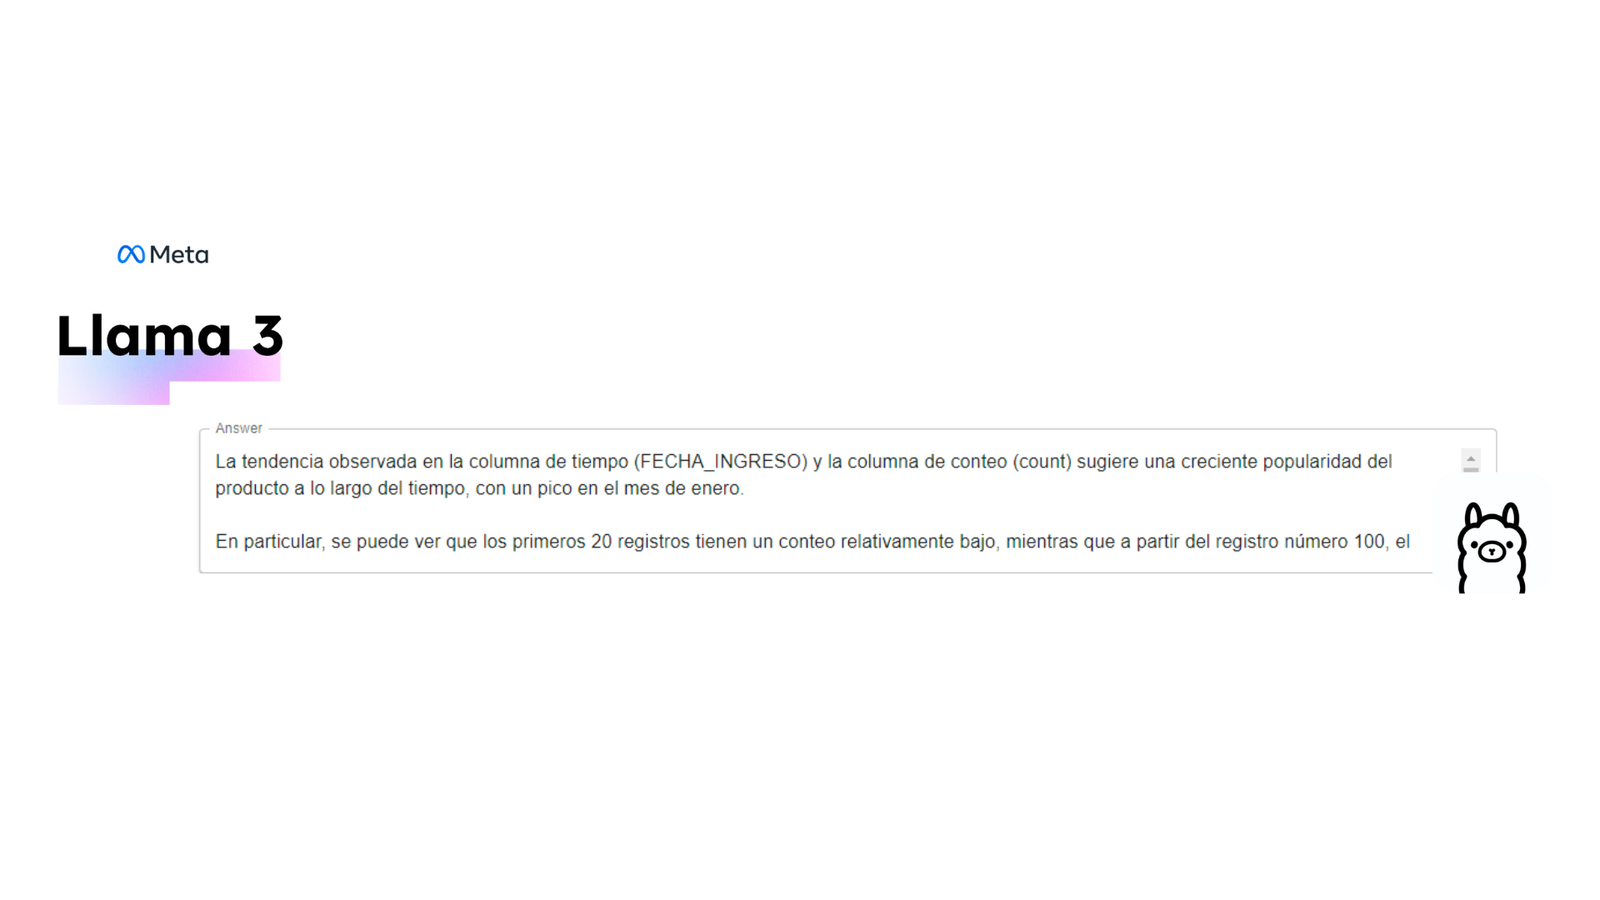
Many people don’t have knowledge analyzing data and understanding this one. The LLM model can understand, interpret and facilitate the insight behind information to give insights. For testing Ollama has some models to use. In this case the selected model was llama 3 and give insights for the shared chart.
